
Visualizations
Make the relationship visible.
Then ask what it means.
Reveal structure, scale and change through representations learners can inspect. A visualization becomes a learning experience when they compare, construct and explain what it shows.
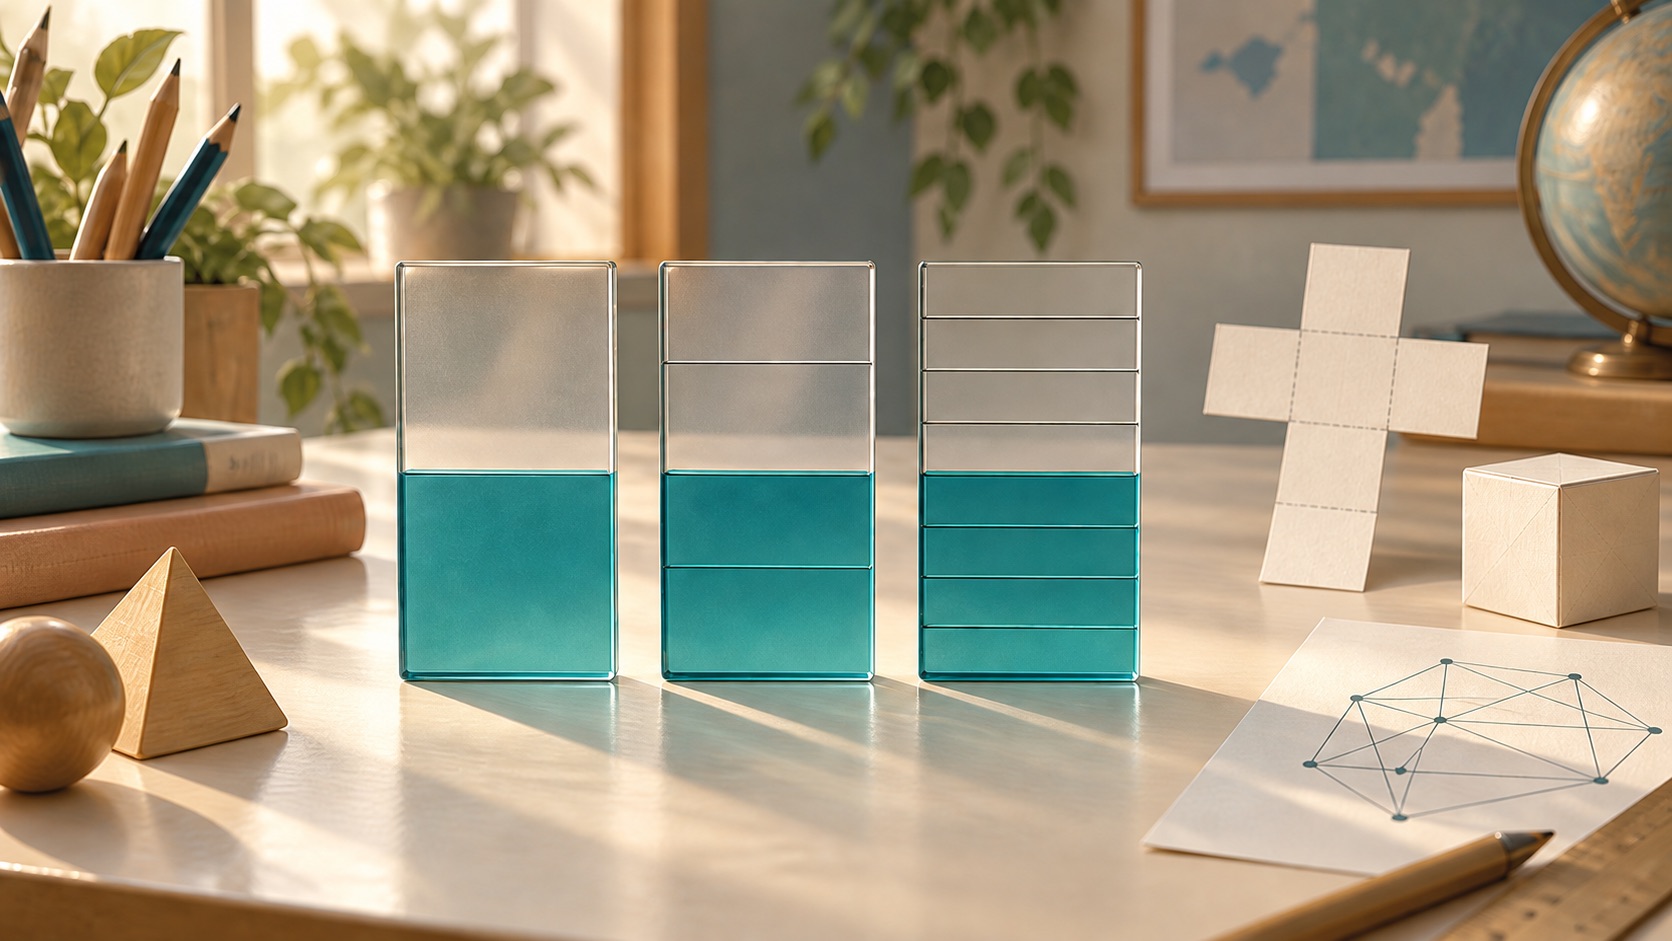
Show a relationship, not decoration.
Position, size, shape and change serve a defined idea, so learners know what to compare and what each visual feature represents.
Move between representations.
Learners connect the visual with words, symbols, measurements or a physical model instead of treating it as a picture to remember.
Ask learners to reconstruct the idea.
Creating or interpreting a fresh representation reveals more than recognising the one already explained.
FROM OBJECTIVE TO EXPERIENCE
Different subjects.
Purposeful possibilities.
Start with what learners should understand. Shape the experience around the thinking you want to see.
Fractions Through the Same Whole
Layer translucent fraction panels over equal wholes, compare covered areas and build a new panel that represents the same amount.
Explain equivalence through area and connect the visual to fraction notation.
A Cube Before It Folds
Rotate and fold several cube nets, mark faces that will meet and explain why one arrangement cannot close without overlap.
Reason between two-dimensional nets and three-dimensional spatial relationships.
A Century in Layers
Read population, transport and land-use layers on the same city map, then explain one supported change without implying a cause the data cannot show.
Interpret layered data and distinguish visible association from a causal claim.
INSIDE A LEARNING MOMENT
Build one half three ways.
Fraction panels turn equivalence into an area relationship learners can compare, describe and reconstruct.
How can different numbers of pieces cover the same amount of one whole?
Fix the whole
Place one-half over a reference square and describe the covered area. Keep every later whole the same size and orientation.
Overlay another partition
Add fourths and find the pieces that align exactly with one-half. Connect two of four equal pieces with the notation 2/4.
Explain what stays equal
Compare the number and size of pieces while tracking the unchanged covered area. State why 1/2 and 2/4 represent equal amounts here.
Construct a new match
Choose a different partition, build another representation of one-half and justify it without copying the overlay already shown.
The teacher can review the constructed panel and explanation together, then choose a new whole or symbolic problem to probe the idea further.
MAKE THINKING VISIBLE
Notice the reasoning.
Choose what comes next.
Use the response, the process, and the help involved to decide what a learner needs next. Educator judgment stays central.
Features noticed
Selections, comparisons and annotations reveal which visual relationships the learner attends to and which may still be misleading.
Connections between forms
Explanations linking area, language and notation show whether the representation supports the intended concept.
A representation constructed
A new panel, net or data view with a reasoned explanation provides evidence beyond recognition of a worked example.
EDUCATOR CONTROL
Your objective.
Your teaching decisions.
Create, adapt, review, and assign with the learning conditions in view.
Choose the relation to reveal
Set the objective and decide which dimensions, labels, scales and comparisons are essential; remove visual detail that competes with them.
Review accuracy and provenance
Check data, geometry, scale, labels and source context. Keep uncertainty visible and do not let an attractive display overstate a claim.
Provide a nonvisual route
Add structured descriptions, data tables, keyboard exploration, tactile or printable alternatives and cues that do not rely on colour alone.
Control guidance and reveal
Choose when labels, comparison guides or worked overlays appear, record their use and end with an unscaffolded construction or interpretation.
Visualizations
Reveal the pattern.
Let learners build the meaning.